Clinical Accuracy Testing Data
The accuracy of the Infinity Automatic Coding Blood Glucose Monitoring System System was assessed by comparing blood glucose results obtained by patients with those obtained using the Hitachi Glucose Auto analyzer 747, a laboratory instrument. Glucose levels were measured by 160 diabetic patients at three different clinical centers.
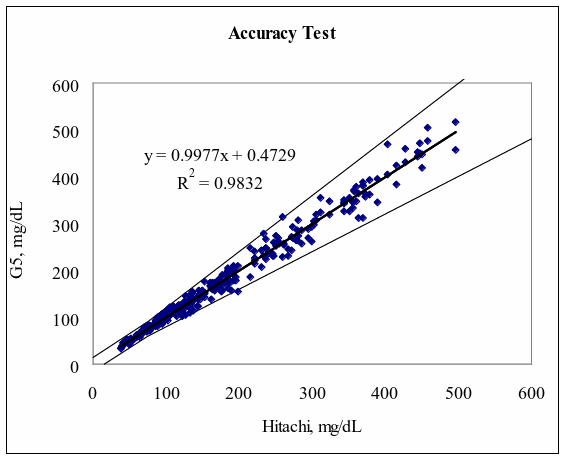
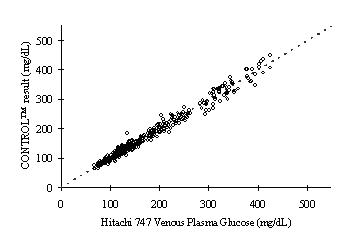
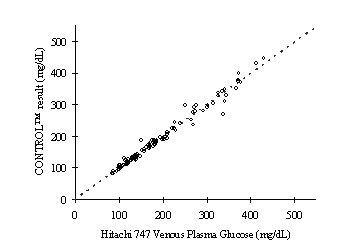
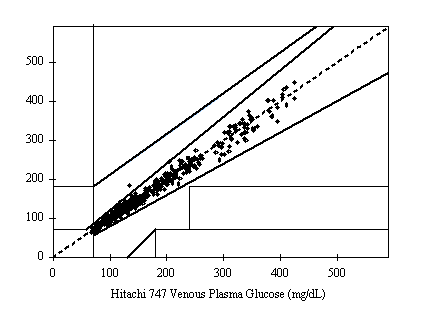
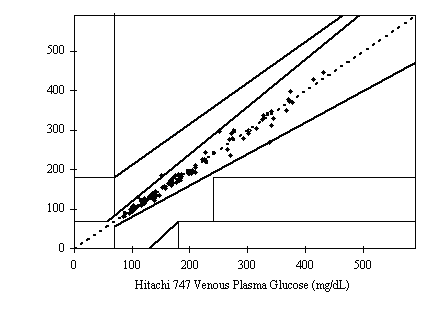
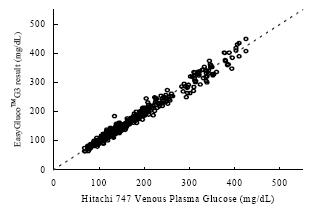
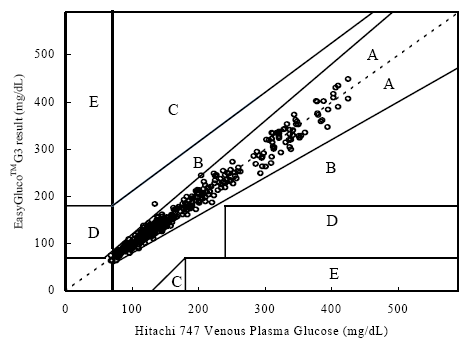
A fine and direct correlation between the Hitachi 747 and the Infinity Automatic Coding Blood Glucose Monitoring System was confirmed in 160 blood samples with the correlation coefficient R=0.9832 (Figure 1). The results indicate the Infinity Automatic Coding Blood Glucose Monitoring System generates similar results as the Hitachi 747, a laboratory instrument used in hospitals to test glucose concentration. The data further demonstrates compliance with the international standard ISO151197 and is within acceptance criteria.
Figure 1: Linear regression of the 160 blood glucose samples with the Hitachi 747 vs. G5 INFINITY® System at the Clinical Centers.
Test Range 38 ~ 496 mg/dL
sample No = 160
data No = 320
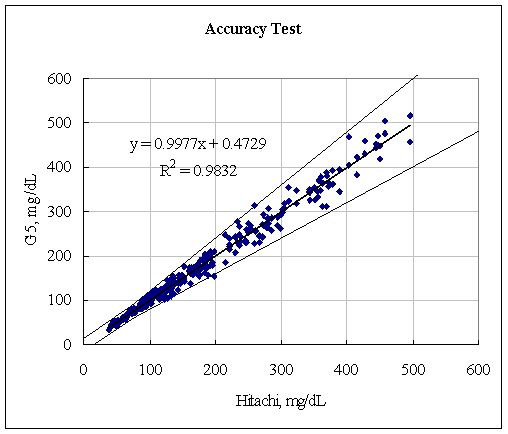
Table 1: Glucose concentration of sample for system accuracyevaluation
glucose concentration (mg/dL) |
percentage of sample |
sample # |
< 50 |
5% |
8 |
50 to 80 |
15% |
24 |
80 to 120 |
20% |
32 |
120 to 200 |
30% |
48 |
201 to 300 |
15% |
24 |
301 to 400 |
10% |
16 |
> 400 |
5% |
8 |
SUM |
100% |
160 |
User Performance Evaluation
Procedure:
To test the accuracy of the Infinity Automatic Coding Blood Glucose Monitoring System , 150 individuals participated in a study at three clinical sites- 50 users at each site.
The participants were each provided with an Infinity Automatic Coding Blood Glucose Monitoring System labeled and packaged as it would be for the United States market in English. The testers were given sufficient time to read and understand instructions and the contents of the Infinity® system (on their own). Participants did not receive additional training, other instruction, assistance, or training material.
The individuals performed their own finger sticks and test themselves using Infinity Automatic Coding Blood Glucose Monitoring System without supervision other than that necessary to insure that accurate results were properly recorded. Subsequently, healthcare professionals gathered user’s capillary whole blood by skin puncture and measured the glucose using the same Infinity Automatic Coding Blood Glucose Monitoring System system. By additional skin puncture within 5 min of G5 INFINITY® test, healthcare professional gathered capillary whole blood in the capillary anticoagulant tube. This capillary whole blood was centrifuged, and then this plasma’s glucose was measured by the HITACHI 747.
Conclusion:
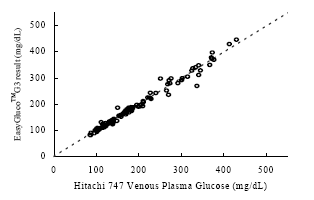
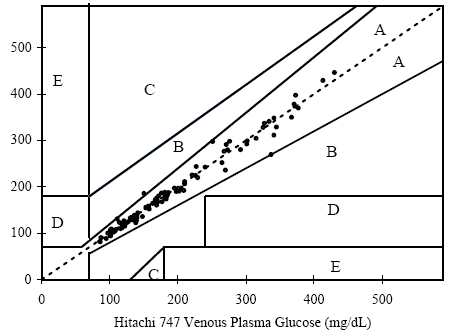
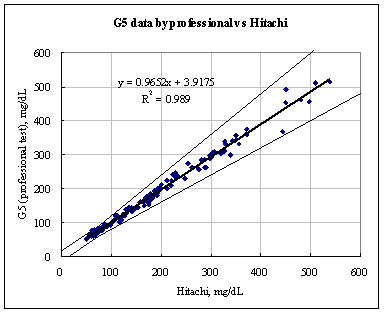
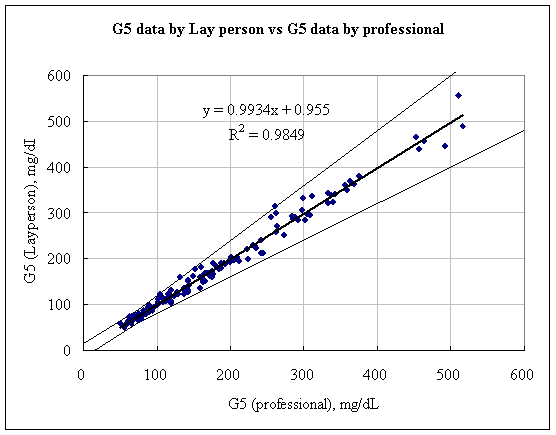
As shown in the figures below, the results show a fine correlation in accuracy between layperson and healthcare professionals with the correlation of R2 = 0.9849. As a result, the data shown indicates that the results satisfy the accuracy standard of ISO15197 and is within acceptance criteria.
DATA RESULTS
Figure 1. Linear regression of the 150 blood glucose samples with the Hitachi 747 vs. G5 INFINITY® System at the Clinical Centers.
Samples No=150
Test range = 50~537 mg/dL
Samples No=150
Test range = 50~537 mg/dL
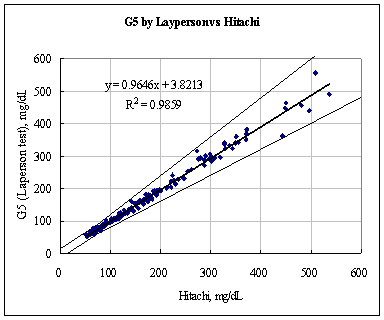
Figure 2. Linear regression of Layperson results vs. Healthcare professional results
Samples No=150
Test range = 50~537 mg/dL
DATA ANALYSIS
System accuracy results for glucose concentration <75 mg/dL (4.2 mmol/L)
Within ± 5mg/dL |
Within ± 10 mg/dL |
Within ± 15mg/dL |
(within ± 0.28 mmol/L) |
(within ± 0.56 mmol/L) |
(within ± 0.83 mmol/L) |
8/25 (32 %) |
24/25(96 %) |
25/25(100%) |
System accuracy results for glucose concentration ≥75 mg/dL (4.2 mmol/L)
Within ±5% |
Within ±10% |
Within ±15% |
Within ±20% |
74/125(59%) |
108/125(86%) |
121/125(97%) |
123/125(98%) |
Hematocrit Effect on Blood Glucose Measurements Study
The Hematocrit Effect Test is designed to evaluate the Hematocrit-dependent variations in the whole blood glucose measurements with the Infinity Automatic Coding Blood Glucose Monitoring System
Procedure:
The test was performed by measuring spiked glucose levels in blood samples which are prepared to contain designated level of hematocrit ( 20, 30, 40, 50, 60%) from cetriguged whole blood. The concentration of glucose was adjusted in each hematocrit percentage to eight levels: (40, 70, 110, 160, 260, 350, 450, 550mg/dL) through either hydrolyses or analytical spiking. Each sample was tested 15 times with evolution system. The plasma serum glucose value of the Hct 40% sample is measured by YSI 2300 STAT PLUS, the hematocrit of the sample is measured by NOVA STAT profile.
Conclusion:
As shown in the figures below, the results demonstrate that the Hematocrit-dependent variations in the whole blood glucose measurements with the Infinity Automatic Coding Blood Glucose Monitoring System are within the acceptable range and safe to use for blood glucose monitoring purposes.
Results of Blood Glucose and Hematocrit Range
Table 1. data results
Data unit: mg/dL
Y S I (mg/dL) of 40% Hct sample – 44 mg/dL |
|||||||||||||||||
Hct % |
1 |
2 |
3 |
4 |
5 |
6 |
7 |
8 |
9 |
10 |
11 |
12 |
13 |
14 |
15 |
Mean |
CV |
20 |
45 |
46 |
49 |
48 |
45 |
46 |
47 |
46 |
46 |
49 |
48 |
47 |
46 |
48 |
50 |
47.1 |
3.1 |
31 |
46 |
45 |
49 |
46 |
43 |
45 |
48 |
47 |
48 |
47 |
48 |
48 |
46 |
49 |
46 |
46.7 |
3.4 |
39 |
45 |
46 |
48 |
45 |
44 |
42 |
44 |
43 |
44 |
43 |
41 |
44 |
42 |
44 |
43 |
43.9 |
3.8 |
50 |
43 |
40 |
46 |
43 |
42 |
41 |
43 |
42 |
44 |
40 |
39 |
44 |
42 |
41 |
46 |
42.4 |
4.7 |
59 |
40 |
38 |
38 |
41 |
42 |
40 |
37 |
40 |
42 |
41 |
40 |
41 |
43 |
39 |
38 |
40.0 |
4.2 |
Y S I (mg/dL) of 40% Hct sample –75 mg/dL |
|||||||||||||||||
Hct % |
1 |
2 |
3 |
4 |
5 |
6 |
7 |
8 |
9 |
10 |
11 |
12 |
13 |
14 |
15 |
Mean |
CV |
21 |
78 |
79 |
76 |
76 |
78 |
75 |
76 |
79 |
78 |
79 |
80 |
79 |
76 |
78 |
82 |
77.9 |
2.3 |
30 |
76 |
74 |
75 |
76 |
72 |
78 |
74 |
75 |
79 |
76 |
73 |
75 |
76 |
77 |
78 |
75.6 |
2.5 |
41 |
72 |
73 |
71 |
72 |
73 |
72 |
74 |
76 |
70 |
71 |
72 |
72 |
70 |
74 |
70 |
72.1 |
2.3 |
51 |
70 |
66 |
63 |
66 |
69 |
68 |
65 |
66 |
66 |
70 |
64 |
68 |
67 |
67 |
69 |
66.9 |
3.0 |
60 |
65 |
69 |
62 |
65 |
63 |
65 |
64 |
67 |
65 |
63 |
68 |
65 |
64 |
65 |
63 |
64.9 |
2.9 |
Y S I (mg/dL) of 40% Hct sample – 111 mg/dL |
|||||||||||||||||
Hct % |
1 |
2 |
3 |
4 |
5 |
6 |
7 |
8 |
9 |
10 |
11 |
12 |
13 |
14 |
15 |
Mean |
CV |
21 |
116 |
118 |
116 |
120 |
118 |
115 |
117 |
115 |
120 |
118 |
114 |
123 |
117 |
117 |
117 |
117.4 |
1.9 |
29 |
111 |
115 |
112 |
108 |
113 |
116 |
112 |
111 |
110 |
114 |
112 |
113 |
113 |
115 |
111 |
112.4 |
1.8 |
42 |
108 |
109 |
111 |
112 |
105 |
109 |
109 |
110 |
113 |
110 |
111 |
110 |
114 |
111 |
109 |
110.1 |
1.9 |
51 |
105 |
103 |
102 |
106 |
108 |
109 |
110 |
102 |
109 |
111 |
107 |
106 |
108 |
108 |
108 |
106.8 |
2.5 |
59 |
101 |
102 |
102 |
105 |
103 |
106 |
101 |
105 |
107 |
105 |
101 |
105 |
102 |
105 |
104 |
103.6 |
1.9 |
Y S I (mg/dL) of 40% Hct sample – 163 mg/dL |
|||||||||||||||||
Hct % |
1 |
2 |
3 |
4 |
5 |
6 |
7 |
8 |
9 |
10 |
11 |
12 |
13 |
14 |
15 |
Mean |
CV |
20 |
169 |
170 |
168 |
169 |
168 |
165 |
172 |
173 |
170 |
169 |
170 |
171 |
175 |
171 |
170 |
170.0 |
1.3 |
33 |
165 |
167 |
165 |
166 |
162 |
166 |
168 |
166 |
164 |
162 |
161 |
165 |
166 |
168 |
164 |
165.0 |
1.2 |
41 |
158 |
156 |
158 |
159 |
158 |
156 |
159 |
160 |
161 |
158 |
157 |
158 |
159 |
162 |
160 |
158.6 |
1.0 |
49 |
155 |
153 |
150 |
152 |
154 |
158 |
153 |
150 |
149 |
152 |
153 |
153 |
154 |
156 |
150 |
152.8 |
1.6 |
60 |
147 |
152 |
150 |
146 |
150 |
140 |
149 |
146 |
149 |
143 |
146 |
144 |
143 |
147 |
139 |
146.1 |
2.5 |
Y S I (mg/dL) of 40% Hct sample – 257 mg/dL |
|||||||||||||||||
Hct % |
1 |
2 |
3 |
4 |
5 |
6 |
7 |
8 |
9 |
10 |
11 |
12 |
13 |
14 |
15 |
Mean |
CV |
22 |
268 |
269 |
270 |
267 |
265 |
266 |
268 |
263 |
269 |
270 |
263 |
268 |
265 |
267 |
267 |
267.0 |
0.8 |
32 |
259 |
258 |
259 |
263 |
260 |
251 |
257 |
254 |
258 |
257 |
253 |
256 |
255 |
259 |
260 |
257.3 |
1.2 |
40 |
255 |
253 |
253 |
256 |
255 |
251 |
250 |
255 |
258 |
257 |
255 |
254 |
253 |
254 |
252 |
254.1 |
0.8 |
50 |
244 |
250 |
249 |
248 |
249 |
253 |
250 |
249 |
247 |
250 |
248 |
244 |
248 |
249 |
251 |
248.6 |
0.9 |
59 |
235 |
236 |
238 |
233 |
239 |
241 |
248 |
243 |
235 |
239 |
237 |
233 |
238 |
236 |
240 |
238.1 |
1.6 |
Table 2. Data analysis
Data unit: Difference , mg/dL
Y S I (mg/dL) of 40% Hct sample – 44 mg/dL |
||||||||||||||||
Hct % |
1 |
2 |
3 |
4 |
5 |
6 |
7 |
8 |
9 |
10 |
11 |
12 |
13 |
14 |
15 |
|
20 |
1.1 |
2.1 |
5.1 |
4.1 |
1.1 |
2.1 |
3.1 |
2.1 |
2.1 |
5.1 |
4.1 |
3.1 |
2.1 |
4.1 |
6.1 |
|
31 |
2.1 |
1.1 |
5.1 |
2.1 |
-0.9 |
1.1 |
4.1 |
3.1 |
4.1 |
3.1 |
4.1 |
4.1 |
2.1 |
5.1 |
2.1 |
|
39 |
0 |
0 |
0 |
0 |
0 |
0 |
0 |
0 |
0 |
0 |
0 |
0 |
0 |
0 |
0 |
|
50 |
-0.9 |
-3.9 |
2.1 |
-0.9 |
-1.9 |
-2.9 |
-0.9 |
-1.9 |
0.1 |
-3.9 |
-4.9 |
0.1 |
-1.9 |
-2.9 |
2.1 |
|
59 |
-3.9 |
-5.9 |
-5.9 |
-2.9 |
-1.9 |
-3.9 |
-6.9 |
-3.9 |
-1.9 |
-2.9 |
-3.9 |
-2.9 |
-0.9 |
-4.9 |
-5.9 |
|
Y S I (mg/dL) of 40% Hct sample – 75 mg/dL |
||||||||||||||||
Hct % |
1 |
2 |
3 |
4 |
5 |
6 |
7 |
8 |
9 |
10 |
11 |
12 |
13 |
14 |
15 |
|
21 |
5.9 |
6.9 |
3.9 |
3.9 |
5.9 |
2.9 |
3.9 |
6.9 |
5.9 |
6.9 |
7.9 |
6.9 |
3.9 |
5.9 |
9.9 |
|
30 |
3.9 |
1.9 |
2.9 |
3.9 |
-0.1 |
5.9 |
1.9 |
2.9 |
6.9 |
3.9 |
0.9 |
2.9 |
3.9 |
4.9 |
5.9 |
|
41 |
0 |
0 |
0 |
0 |
0 |
0 |
0 |
0 |
0 |
0 |
0 |
0 |
0 |
0 |
0 |
|
51 |
-2.1 |
-6.1 |
-9.1 |
-6.1 |
-3.1 |
-4.1 |
-7.1 |
-6.1 |
-6.1 |
-2.1 |
-8.1 |
-4.1 |
-5.1 |
-5.1 |
-3.1 |
|
60 |
-7.1 |
-3.1 |
-10.1 |
-7.1 |
-9.1 |
-7.1 |
-8.1 |
-5.1 |
-7.1 |
-9.1 |
-4.1 |
-7.1 |
-8.1 |
-7.1 |
-9.1 |
|
Data unit: Err ,% |
||||||||||||||||
Y S I (mg/dL) of 40% Hct sample - 111 mg/dL |
||||||||||||||||
Hct % |
1 |
2 |
3 |
4 |
5 |
6 |
7 |
8 |
9 |
10 |
11 |
12 |
13 |
14 |
15 |
|
21 |
5.4 |
7.2 |
5.4 |
9.0 |
7.2 |
4.5 |
6.3 |
4.5 |
9.0 |
7.2 |
3.6 |
11.8 |
6.3 |
6.3 |
6.3 |
|
29 |
0.8 |
4.5 |
1.8 |
-1.9 |
2.7 |
5.4 |
1.8 |
0.8 |
-0.1 |
3.6 |
1.8 |
2.7 |
2.7 |
4.5 |
0.8 |
|
42 |
0 |
0 |
0 |
0 |
0 |
0 |
0 |
0 |
0 |
0 |
0 |
0 |
0 |
0 |
0 |
|
51 |
-4.6 |
-6.4 |
-7.3 |
-3.7 |
-1.9 |
-1.0 |
-0.1 |
-7.3 |
-1.0 |
0.8 |
-2.8 |
-3.7 |
-1.9 |
-1.9 |
-1.9 |
|
59 |
-8.2 |
-7.3 |
-7.3 |
-4.6 |
-6.4 |
-3.7 |
-8.2 |
-4.6 |
-2.8 |
-4.6 |
-8.2 |
-4.6 |
-7.3 |
-4.6 |
-5.5 |
|
Y S I (mg/dL) of 40% Hct sample - 163 mg/dL |
||||||||||||||||
Hct % |
1 |
2 |
3 |
4 |
5 |
6 |
7 |
8 |
9 |
10 |
11 |
12 |
13 |
14 |
15 |
|
20 |
6.6 |
7.2 |
5.9 |
6.6 |
5.9 |
4.0 |
8.4 |
9.1 |
7.2 |
6.6 |
7.2 |
7.8 |
10.3 |
7.8 |
7.2 |
|
33 |
4.0 |
5.3 |
4.0 |
4.7 |
2.1 |
4.7 |
5.9 |
4.7 |
3.4 |
2.1 |
1.5 |
4.0 |
4.7 |
5.9 |
3.4 |
|
41 |
0 |
0 |
0 |
0 |
0 |
0 |
0 |
0 |
0 |
0 |
0 |
0 |
0 |
0 |
0 |
|
49 |
-2.3 |
-3.5 |
-5.4 |
-4.2 |
-2.9 |
-0.4 |
-3.5 |
-5.4 |
-6.1 |
-4.2 |
-3.5 |
-3.5 |
-2.9 |
-1.6 |
-5.4 |
|
60 |
-7.3 |
-4.2 |
-5.4 |
-7.9 |
-5.4 |
-11.7 |
-6.1 |
-7.9 |
-6.1 |
-9.8 |
-7.9 |
-9.2 |
-9.8 |
-7.3 |
-12.4 |
|
Y S I (mg/dL) of 40% Hct sample – 257 mg/dL |
||||||||||||||||
Hct % |
1 |
2 |
3 |
4 |
5 |
6 |
7 |
8 |
9 |
10 |
11 |
12 |
13 |
14 |
15 |
|
22 |
5.5 |
5.9 |
6.3 |
5.1 |
4.3 |
4.7 |
5.5 |
3.5 |
5.9 |
6.3 |
3.5 |
5.5 |
4.3 |
5.1 |
5.1 |
|
32 |
1.9 |
1.5 |
1.9 |
3.5 |
2.3 |
-1.2 |
1.2 |
0.0 |
1.5 |
1.2 |
-0.4 |
0.8 |
0.4 |
1.9 |
2.3 |
|
40 |
0 |
0 |
0 |
0 |
0 |
0 |
0 |
0 |
0 |
0 |
0 |
0 |
0 |
0 |
0 |
|
50 |
-4.0 |
-1.6 |
-2.0 |
-2.4 |
-2.0 |
-0.4 |
-1.6 |
-2.0 |
-2.8 |
-1.6 |
-2.4 |
-4.0 |
-2.4 |
-2.0 |
-1.2 |
|
59 |
-7.5 |
-7.1 |
-6.3 |
-8.3 |
-5.9 |
-5.1 |
-2.4 |
-4.4 |
-7.5 |
-5.9 |
-6.7 |
-8.3 |
-6.3 |
-7.1 |
-5.5 |
|
Y S I (mg/dL) of 40% Hct sample –371 mg/dL |
||||||||||||||||
Hct % |
1 |
2 |
3 |
4 |
5 |
6 |
7 |
8 |
9 |
10 |
11 |
12 |
13 |
14 |
15 |
|
20 |
6.0 |
6.8 |
6.2 |
6.8 |
3.0 |
5.4 |
6.0 |
6.8 |
4.9 |
6.0 |
6.8 |
7.0 |
6.2 |
4.9 |
6.8 |
|
32 |
3.0 |
1.7 |
3.3 |
1.7 |
1.2 |
1.7 |
2.2 |
4.1 |
3.0 |
1.7 |
0.6 |
4.1 |
1.7 |
2.0 |
2.2 |
|
40 |
0 |
0 |
0 |
0 |
0 |
0 |
0 |
0 |
0 |
0 |
0 |
0 |
0 |
0 |
0 |
|
55 |
-5.8 |
-4.7 |
-5.0 |
-3.7 |
-4.7 |
-6.1 |
-4.7 |
-5.5 |
-1.5 |
-5.0 |
-4.2 |
-3.9 |
-5.0 |
-5.8 |
-7.1 |
|
58 |
-8.7 |
-7.4 |
-6.9 |
-8.5 |
-9.3 |
-8.5 |
-9.0 |
-7.7 |
-7.9 |
-7.4 |
-9.8 |
-9.0 |
-8.5 |
-6.9 |
-8.7 |
|
Y S I (mg/dL) of 40% Hct sample – 438 mg/dL |
||||||||||||||||
Hct % |
1 |
2 |
3 |
4 |
5 |
6 |
7 |
8 |
9 |
10 |
11 |
12 |
13 |
14 |
15 |
|
20 |
9.0 |
8.7 |
8.3 |
9.2 |
9.0 |
9.4 |
8.7 |
10.1 |
9.2 |
9.9 |
8.5 |
7.5 |
6.8 |
9.7 |
9.4 |
|
29 |
5.9 |
6.1 |
5.9 |
5.7 |
5.2 |
6.1 |
6.8 |
5.4 |
4.2 |
8.3 |
6.4 |
4.2 |
5.4 |
6.1 |
4.2 |
|
41 |
0 |
0 |
0 |
0 |
0 |
0 |
0 |
0 |
0 |
0 |
0 |
0 |
0 |
0 |
0 |
|
50 |
-3.1 |
-4.3 |
-2.6 |
-2.4 |
-1.7 |
-5.0 |
-3.6 |
-3.3 |
-2.6 |
-3.1 |
-3.1 |
-1.7 |
-2.4 |
-3.1 |
-3.8 |
|
60 |
-5.2 |
-4.7 |
-4.7 |
-4.3 |
-3.6 |
-2.6 |
-3.8 |
-4.0 |
-4.7 |
-2.6 |
-3.6 |
-1.4 |
-5.2 |
-4.0 |
-5.5 |
|
Y S I (mg/dL) of 40% Hct sample – 543 mg/dL |
||||||||||||||||
Hct % |
1 |
2 |
3 |
4 |
5 |
6 |
7 |
8 |
9 |
10 |
11 |
12 |
13 |
14 |
15 |
|
21 |
7.8 |
9.3 |
7.5 |
7.8 |
8.6 |
9.3 |
7.3 |
7.8 |
7.5 |
8.0 |
7.7 |
9.0 |
7.8 |
7.5 |
7.5 |
|
33 |
3.0 |
1.9 |
2.5 |
3.6 |
1.9 |
1.4 |
3.0 |
3.2 |
2.8 |
2.5 |
1.9 |
2.3 |
3.6 |
3.4 |
2.1 |
|
43 |
0 |
0 |
0 |
0 |
0 |
0 |
0 |
0 |
0 |
0 |
0 |
0 |
0 |
0 |
0 |
|
52 |
-3.6 |
-5.3 |
-4.2 |
-5.1 |
-3.8 |
-5.1 |
-4.8 |
-2.2 |
-3.3 |
-4.0 |
-3.3 |
-3.1 |
-4.4 |
-4.2 |
-4.2 |
|
59 |
-9.4 |
-7.5 |
-8.1 |
-7.9 |
-7.5 |
-7.4 |
-9.2 |
-8.1 |
-8.3 |
-9.2 |
-8.1 |
-9.0 |
-9.6 |
-8.8 |
-9.2 |
|
Table 3. Summary of results
Y S I ( mg/dL) |
number of samples within |
percentage of sample |
number of samples within |
percentage of sample |
Criteria |
< 75 mg/dL |
119 |
99% |
120 |
100% |
PASS |
At < 75 mg/dL sample, total test number is 120 |
|||||
Y S I ( mg/dL) |
number of samples within |
percentage of sample |
number of samples within |
percentage of sample |
Criteria |
≥ 75 mg/dL |
356 |
99% |
360 |
100% |
PASS |
At ≥ 75 mg/dL sample, total test number is 360 |
|||||
Interference Studies
Many monitors approved for home use give the wrong result if patients are taking certain drugs like Tylenol (acetaminophen), vitamin C (ascorbic acid) or maltose (a by=product of a common drug used in dialysis). The tests described in this section are designed to evaluate the effect of various potentially interfering substances in whole blood samples on glucose measurements using the Infinity Automatic Coding Blood Glucose Monitoring System.
Procedure:
DOSE-RESPONSE METHOD (NCCLS EP7-P)
This test (as seen in Table 1, below) is designed to determine the relationship between the concentration of the interferent and the magnitude of its interference. A series of test samples, systematically varying in the concentration of the interferent, is prepared by making quantitative, volumetric admixtures of two pools: one at the highest concentration to be tested and the other at the lowest. The substances and concentration of the interferents are recommended at NCCLS EP7-P and draft document of FDA.
Test series (intermediate pools) – see Table 1
The test samples containing intermediate concentration of the interferent are prepared quantitatively from high and low pools. The preparation scheme is illustrated in Fig 3.
Figure 1: Illustration Scheme of Interferent Testing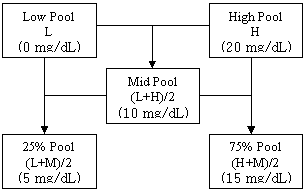
In order to understand the table below, the preparation scheme for the first interferent on the table, Acetaminophen will be used as the example. The sample used may reach as high as 20mg/dl in serum (refer to Appendix A, NCCLS EP7-P).
In this substance, the Acetaminophen, the potential interference is not present in the low pool. Approximately 7 ml of blood was taken from a healthy individual who is not under medication. To increase the pool “High Pool”, 62mg of Acetaminophen was dissolved into 10ml of phosphate buffer and pipette of 100ul of the interferent solution into 3ml blood sample. At the same time 100ul of the phosphate buffer was added without the interefrent substance into 3ml blood sample to make the “Low Pool.” As a result, the 62mg of Acetaminophen with the 10ml buffer added to 0.1ml/3mlblood resulted in (0.2067mg/ml=20.6mg/dl) in the High pool.
Interferences with difference ± 15% should be written on the strip insert with notice sentence.
Conclusion
The interference tests confirms that the tested inferents is less than ±10% in the presence of common interferents even beyond the accepted clinically significant ranges.
Table 1: Interferences
Acetaminophen |
|||||||||
Pool |
Low(L) |
(L+M)/2 |
(L+H)/2(M) |
(M+H)/2 |
High(H) |
||||
Conc. |
0 mg/dL |
5 mg/dL |
10 mg/dL |
15 mg/dL |
20 mg/dL |
||||
Rep. 1 |
162 |
160 |
162 |
165 |
160 |
||||
Rep. 2 |
163 |
159 |
162 |
163 |
163 |
||||
Rep. 3 |
164 |
163 |
163 |
164 |
160 |
||||
Rep. 4 |
163 |
164 |
160 |
162 |
158 |
||||
Rep. 5 |
162 |
165 |
167 |
160 |
164 |
||||
Mean |
162.8 |
162.2 |
162.8 |
162.8 |
161 |
||||
% Difference |
0.0 |
-0.4 |
0.0 |
0.0 |
-1.1 |
||||
Bilirubin |
|||||||||
Pool |
Low(L) |
(L+M)/2 |
(L+H)/2(M) |
(M+H)/2 |
High(H) |
||||
Conc. |
0 mg/dL |
10 mg/dL |
20 mg/dL |
30 mg/dL |
40mg/dL |
||||
Rep. 1 |
154 |
154 |
153 |
146 |
147 |
||||
Rep. 2 |
158 |
151 |
150 |
152 |
146 |
||||
Rep. 3 |
152 |
152 |
152 |
150 |
142 |
||||
Rep. 4 |
154 |
152 |
151 |
147 |
143 |
||||
Rep. 5 |
157 |
153 |
150 |
146 |
145 |
||||
Mean |
155 |
152.4 |
151.2 |
148.2 |
144.6 |
||||
% Difference |
0.0 |
-1.7 |
-2.5 |
-4.4 |
-6.7 |
||||
Gentistic acid |
|||||||||
Pool |
Low(L) |
(L+M)/2 |
(L+H)/2(M) |
(M+H)/2 |
High(H) |
||||
Conc. |
0 mg/dL |
12.5mg/dL |
25 mg/dL |
37.5mg/dL |
50 mg/dL |
||||
Rep. 1 |
162 |
165 |
165 |
169 |
173 |
||||
Rep. 2 |
163 |
163 |
169 |
167 |
171 |
||||
Rep. 3 |
164 |
168 |
167 |
169 |
177 |
||||
Rep. 4 |
163 |
164 |
168 |
174 |
175 |
||||
Rep. 5 |
162 |
169 |
169 |
170 |
176 |
||||
Mean |
162.8 |
165.8 |
167.6 |
169.8 |
174.4 |
||||
% Difference |
0.0 |
1.8 |
2.9 |
4.3 |
7.1 |
||||
Levo-Dopa |
|||||||||
Pool |
Low(L) |
(L+M)/2 |
(L+H)/2(M) |
(M+H)/2 |
High(H) |
||||
Conc. |
0 mg/dL |
1 mg/dL |
2mg/dL |
3 mg/dL |
4 mg/dL |
||||
Rep. 1 |
155 |
155 |
156 |
154 |
154 |
||||
Rep. 2 |
158 |
159 |
159 |
156 |
154 |
||||
Rep. 3 |
156 |
153 |
152 |
157 |
153 |
||||
Rep. 4 |
155 |
157 |
158 |
152 |
154 |
||||
Rep. 5 |
155 |
155 |
158 |
158 |
150 |
||||
Mean |
155.8 |
155.8 |
156.6 |
155.4 |
153 |
||||
% Difference |
0.0 |
0.0 |
0.5 |
-0.3 |
-1.8 |
||||
|
|||||||||
Metyl-Dopa |
|||||||||
Pool |
Low(L) |
(L+M)/2 |
(L+H)/2(M) |
(M+H)/2 |
High(H) |
||||
Conc. |
0 mg/dL |
0.6 mg/dL |
1.25 mg/dL |
1.8 mg/dL |
2.5 mg/dL |
||||
Rep. 1 |
155 |
151 |
153 |
154 |
156 |
||||
Rep. 2 |
158 |
159 |
156 |
152 |
154 |
||||
Rep. 3 |
156 |
159 |
152 |
154 |
158 |
||||
Rep. 4 |
155 |
154 |
157 |
155 |
154 |
||||
Rep. 5 |
155 |
157 |
158 |
155 |
157 |
||||
Mean |
155.8 |
156 |
155.2 |
154 |
155.8 |
||||
% Difference |
0.0 |
0.1 |
-0.4 |
-1.2 |
0.0 |
||||
Tolazamide |
|||||||||
Pool |
Low(L) |
(L+M)/2 |
(L+H)/2(M) |
(M+H)/2 |
High(H) |
||||
Conc. |
0 mg/dL |
1.25mg/dL |
2.5 mg/dL |
7.5 mg/dL |
5 mg/dL |
||||
Rep. 1 |
154 |
157 |
158 |
160 |
163 |
||||
Rep. 2 |
158 |
156 |
155 |
157 |
160 |
||||
Rep. 3 |
152 |
154 |
156 |
158 |
161 |
||||
Rep. 4 |
154 |
156 |
158 |
159 |
162 |
||||
Rep. 5 |
157 |
159 |
158 |
160 |
161 |
||||
Mean |
155 |
156.4 |
157 |
158.8 |
161.4 |
||||
% Difference |
0.0 |
0.9 |
1.3 |
2.5 |
4.1 |
||||
Dopamine |
|||||||||
Pool |
Low(L) |
(L+M)/2 |
(L+H)/2(M) |
(M+H)/2 |
High(H) |
||||
Conc. |
0 mg/dL |
3.25 mg/dL |
6.5 mg/dL |
9.7 mg/dL |
13 mg/dL |
||||
Rep. 1 |
162 |
159 |
160 |
163 |
166 |
||||
Rep. 2 |
163 |
160 |
163 |
164 |
165 |
||||
Rep. 3 |
164 |
167 |
160 |
162 |
166 |
||||
Rep. 4 |
163 |
164 |
161 |
160 |
160 |
||||
Rep. 5 |
162 |
165 |
164 |
160 |
166 |
||||
Mean |
162.8 |
163 |
161.6 |
161.8 |
164.6 |
||||
% Difference |
0.0 |
0.1 |
-0.7 |
-0.6 |
1.1 |
||||
Ascorbate |
|||||||||
Pool |
Low(L) |
(L+M)/2 |
(L+H)/2(M) |
(M+H)/2 |
High(H) |
||||
Conc. |
0 mg/dL |
0.75mg/dL |
1.5 mg/dL |
2.25mg/dL |
3 mg/dL |
||||
Rep. 1 |
162 |
162 |
165 |
169 |
168 |
||||
Rep. 2 |
163 |
162 |
169 |
164 |
169 |
||||
Rep. 3 |
164 |
168 |
163 |
164 |
167 |
||||
Rep. 4 |
163 |
164 |
163 |
168 |
169 |
||||
Rep. 5 |
162 |
160 |
164 |
167 |
170 |
||||
Mean |
162.8 |
163.2 |
164.8 |
166.4 |
168.6 |
||||
% Difference |
0.0 |
0.2 |
1.2 |
2.2 |
3.6 |
||||
EDTA |
|||||||||
Pool |
Low(L) |
(L+M)/2 |
(L+H)/2(M) |
(M+H)/2 |
High(H) |
||||
Conc. |
0 mg/dL |
160 mg/dL |
320 mg/dL |
480 mg/dL |
640 mg/dL |
||||
Rep. 1 |
162 |
168 |
166 |
170 |
166 |
||||
Rep. 2 |
163 |
163 |
169 |
169 |
169 |
||||
Rep. 3 |
164 |
165 |
167 |
174 |
174 |
||||
Rep. 4 |
163 |
163 |
164 |
166 |
170 |
||||
Rep. 5 |
162 |
164 |
165 |
165 |
171 |
||||
Mean |
162.8 |
164.6 |
166.2 |
168.8 |
170.0 |
||||
% Difference |
0.0 |
1.1 |
2.1 |
3.7 |
4.4 |
||||
Glutathione |
|||||||||
Pool |
Low(L) |
(L+M)/2 |
(L+H)/2(M) |
(M+H)/2 |
High(H) |
||||
Conc. |
0 mg/dL |
0.25 mg/dL |
0.5 mg/dL |
0.75 mg/dL |
1 mg/dL |
||||
Rep. 1 |
162 |
163 |
163 |
161 |
160 |
||||
Rep. 2 |
163 |
163 |
162 |
160 |
158 |
||||
Rep. 3 |
164 |
164 |
163 |
159 |
159 |
||||
Rep. 4 |
163 |
163 |
161 |
163 |
160 |
||||
Rep. 5 |
162 |
160 |
160 |
163 |
159 |
||||
Mean |
162.8 |
162.6 |
161.8 |
161.2 |
159.2 |
||||
% Difference |
0.0 |
-0.1 |
-0.6 |
-1.0 |
-2.2 |
||||
Heparin |
|||||||||
Pool |
Low(L) |
(L+M)/2 |
(L+H)/2(M) |
(M+H)/2 |
High(H) |
||||
Conc. |
0 mg/dL |
25 mg/dL |
50 mg/dL |
75 mg/dL |
100 mg/dL |
||||
Rep. 1 |
162 |
160 |
160 |
160 |
161 |
||||
Rep. 2 |
163 |
162 |
162 |
165 |
165 |
||||
Rep. 3 |
164 |
163 |
163 |
160 |
163 |
||||
Rep. 4 |
163 |
164 |
164 |
161 |
163 |
||||
Rep. 5 |
162 |
162 |
164 |
163 |
157 |
||||
Mean |
162.8 |
162.2 |
162.6 |
161.8 |
161.8 |
||||
% Difference |
0.0 |
-0.4 |
-0.1 |
-0.6 |
-0.6 |
||||
Ibuprofen |
|||||||||
Pool |
Low(L) |
(L+M)/2 |
(L+H)/2(M) |
(M+H)/2 |
High(H) |
||||
Conc. |
0 mg/dL |
10 mg/dL |
20 mg/dL |
30 mg/dL |
40 mg/dL |
||||
Rep. 1 |
160 |
159 |
158 |
154 |
153 |
||||
Rep. 2 |
159 |
162 |
156 |
158 |
155 |
||||
Rep. 3 |
162 |
160 |
158 |
157 |
154 |
||||
Rep. 4 |
160 |
157 |
159 |
156 |
156 |
||||
Rep. 5 |
158 |
158 |
159 |
158 |
153 |
||||
Mean |
159.8 |
159.2 |
158.0 |
156.6 |
154.2 |
||||
% Difference |
0.0 |
-0.4 |
-1.1 |
-2.0 |
-3.5 |
||||
Salicylic acid |
|||||||||
Pool |
Low(L) |
(L+M)/2 |
(L+H)/2(M) |
(M+H)/2 |
High(H) |
||||
Conc. |
0 mg/dL |
12.5 mg/dL |
25 mg/dL |
37.5 mg/dL |
50 mg/dL |
||||
Rep. 1 |
162 |
160 |
164 |
160 |
163 |
||||
Rep. 2 |
163 |
165 |
163 |
161 |
160 |
||||
Rep. 3 |
164 |
162 |
162 |
161 |
161 |
||||
Rep. 4 |
163 |
163 |
163 |
163 |
159 |
||||
Rep. 5 |
162 |
164 |
165 |
161 |
162 |
||||
Mean |
162.8 |
162.8 |
163.4 |
161.2 |
161 |
||||
% Difference |
0.0 |
0.0 |
0.4 |
-1.0 |
-1.1 |
||||
Tetracycline |
|||||||||
Pool |
Low(L) |
(L+M)/2 |
(L+H)/2(M) |
(M+H)/2 |
High(H) |
||||
Conc. |
0 mg/dL |
0.1 mg/dL |
0.2 mg/dL |
0.3 mg/dL |
0.4 mg/dL |
||||
Rep. 1 |
162 |
162 |
166 |
162 |
169 |
||||
Rep. 2 |
163 |
163 |
165 |
167 |
167 |
||||
Rep. 3 |
164 |
165 |
164 |
170 |
169 |
||||
Rep. 4 |
163 |
164 |
163 |
166 |
171 |
||||
Rep. 5 |
162 |
166 |
168 |
168 |
170 |
||||
Mean |
162.8 |
164.0 |
165.2 |
166.6 |
169.2 |
||||
% Difference |
0.0 |
0.7 |
1.5 |
2.3 |
3.9 |
||||
Tolbutamide |
|||||||||
Pool |
Low(L) |
(L+M)/2 |
(L+H)/2(M) |
(M+H)/2 |
High(H) |
||||
Conc. |
0 mg/dL |
25 mg/dL |
50 mg/dL |
75 mg/dL |
100 mg/dL |
||||
Rep. 1 |
160 |
159 |
158 |
157 |
158 |
||||
Rep. 2 |
159 |
159 |
159 |
156 |
154 |
||||
Rep. 3 |
162 |
157 |
158 |
159 |
156 |
||||
Rep. 4 |
160 |
162 |
161 |
161 |
158 |
||||
Rep. 5 |
158 |
163 |
160 |
158 |
158 |
||||
Mean |
159.8 |
160.0 |
159.2 |
158.2 |
156.8 |
||||
% Difference |
0.0 |
0.1 |
-0.4 |
-1.0 |
-1.9 |
||||
Urea |
|||||||||
Pool |
Low(L) |
(L+M)/2 |
(L+H)/2(M) |
(M+H)/2 |
High(H) |
||||
Conc. |
0 mg/dL |
125 mg/dL |
250 mg/dL |
375 mg/dL |
500 mg/dL |
||||
Rep. 1 |
162 |
163 |
165 |
169 |
175 |
||||
Rep. 2 |
163 |
168 |
174 |
171 |
174 |
||||
Rep. 3 |
164 |
169 |
171 |
173 |
179 |
||||
Rep. 4 |
163 |
165 |
172 |
171 |
175 |
||||
Rep. 5 |
162 |
169 |
170 |
178 |
176 |
||||
Mean |
162.8 |
166.8 |
170.4 |
172.4 |
175.8 |
||||
% Difference |
0.0 |
2.5 |
4.7 |
5.9 |
8.0 |
||||
Uric acid |
|||||||||
Pool |
Low(L) |
(L+M)/2 |
(L+H)/2(M) |
(M+H)/2 |
High(H) |
||||
Conc. |
0 mg/dL |
5 mg/dL |
10 mg/dL |
15 mg/dL |
20 mg/dL |
||||
Rep. 1 |
154 |
135 |
139 |
142 |
143 |
||||
Rep. 2 |
158 |
137 |
136 |
148 |
148 |
||||
Rep. 3 |
152 |
135 |
144 |
150 |
157 |
||||
Rep. 4 |
154 |
136 |
139 |
144 |
150 |
||||
Rep. 5 |
157 |
136 |
138 |
144 |
156 |
||||
Mean |
155.0 |
135.8 |
139.2 |
145.6 |
150.8 |
||||
% Difference |
0.0 |
-12.4 |
-10.2 |
-6.1 |
-2.7 |
||||
Creatinine |
|||||||||
Pool |
Low(L) |
(L+M)/2 |
(L+H)/2(M) |
(M+H)/2 |
High(H) |
||||
Conc. |
0 mg/dL |
7.5 mg/dL |
15 mg/dL |
22.5 mg/dL |
30 mg/dL |
||||
Rep. 1 |
162 |
160 |
162 |
163 |
160 |
||||
Rep. 2 |
163 |
161 |
163 |
160 |
157 |
||||
Rep. 3 |
164 |
163 |
160 |
159 |
159 |
||||
Rep. 4 |
163 |
165 |
162 |
160 |
158 |
||||
Rep. 5 |
162 |
163 |
162 |
160 |
159 |
||||
Mean |
162.8 |
162.4 |
161.8 |
160.4 |
158.6 |
||||
% Difference |
0.0 |
-0.2 |
-0.6 |
-1.5 |
-2.6 |
||||
Cholesterol |
|||||||||
Pool |
Low(L) |
(L+M)/2 |
(L+H)/2(M) |
(M+H)/2 |
High(H) |
||||
Conc. |
0 mg/dL |
175 mg/dL |
350 mg/dL |
525 mg/dL |
700 mg/dL |
||||
Rep. 1 |
156 |
159 |
163 |
167 |
169 |
||||
Rep. 2 |
158 |
160 |
162 |
164 |
170 |
||||
Rep. 3 |
159 |
162 |
163 |
166 |
168 |
||||
Mean |
157.7 |
160.3 |
162.7 |
165.7 |
169.0 |
||||
% Difference |
0.0 |
1.7 |
3.2 |
5.1 |
7.2 |
||||
Triglyceride |
|||||||||
Pool |
Low(L) |
(L+M)/2 |
(L+H)/2(M) |
(M+H)/2 |
High(H) |
||||
Conc. |
0mg/dL |
750 mg/dL |
1500 mg/dL |
2250 mg/dL |
3000 mg/dL |
||||
Rep. 1 |
156 |
156 |
160 |
160 |
163 |
||||
Rep. 2 |
153 |
155 |
155 |
160 |
160 |
||||
Rep. 3 |
152 |
155 |
157 |
159 |
163 |
||||
Mean |
153.7 |
155.3 |
157.3 |
159.7 |
162.0 |
||||
% Difference |
0.0 |
1.1 |
2.4 |
3.9 |
5.4 |
||||
Glactose |
|||||||||
Pool |
Low(L) |
(L+M)/2 |
(L+H)/2(M) |
(M+H)/2 |
High(H) |
||||
Conc. |
0 mg/dL |
12.5 mg/dL |
25 mg/dL |
37.5 mg/dL |
50 mg/dL |
||||
Rep. 1 |
162 |
163 |
162 |
160 |
160 |
||||
Rep. 2 |
163 |
161 |
161 |
160 |
155 |
||||
Rep. 3 |
164 |
162 |
161 |
158 |
158 |
||||
Mean |
163.0 |
162.0 |
161.3 |
159.3 |
157.7 |
||||
% Difference |
0.0 |
-0.6 |
-1.0 |
-2.2 |
-3.3 |
||||
Xylose |
|||||||||
Pool |
Low(L) |
(L+M)/2 |
(L+H)/2(M) |
(M+H)/2 |
High(H) |
||||
Conc. |
0 mg/dL |
2.5 mg/dL |
5mg/dL |
7.5 mg/dL |
10 mg/dL |
||||
Rep. 1 |
162 |
163 |
164 |
163 |
165 |
||||
Rep. 2 |
163 |
163 |
161 |
162 |
163 |
||||
Rep. 3 |
164 |
162 |
163 |
165 |
163 |
||||
Mean |
163.0 |
162.7 |
162.7 |
163.3 |
163.7 |
||||
% Difference |
0.0 |
-0.2 |
-0.2 |
0.2 |
0.4 |
||||
Maltose |
|||||||||
Pool |
Low(L) |
(L+M)/2 |
(L+H)/2(M) |
(M+H)/2 |
High(H) |
||||
Conc. |
0mg/dL |
75 mg/dL |
150 mg/dL |
225 mg/dL |
300 mg/dL |
||||
Rep. 1 |
162 |
160 |
159 |
160 |
153 |
||||
Rep. 2 |
163 |
161 |
159 |
157 |
155 |
||||
Rep. 3 |
164 |
160 |
159 |
156 |
158 |
||||
Mean |
163.0 |
160.3 |
159.0 |
157.7 |
155.3 |
||||
% Difference |
0.0 |
-1.6 |
-2.5 |
-3.3 |
-4.7 |
||||
Table 2: Summary of Tested Interferences:
Mean of Test Results |
||||
Interferences |
High Test Level(mg/dL) |
Low (mg/dL) |
High (mg/dL) |
Error % |
Acetaminophen |
20 |
162.8 |
161.0 |
-1.1 |
Bilirubin |
40 |
155.0 |
144.6 |
-6.7 |
Gentistic acid |
50 |
162.8 |
174.4 |
7.1 |
Uric acid |
20 |
155.0 |
150.8 |
-2.7 |
Levo-Dopa |
4 |
155.8 |
153.0 |
-1.8 |
Creatinine |
30 |
162.8 |
158.6 |
-2.6 |
Methyl-Dopa |
2.5 |
155.8 |
155.8 |
0.0 |
Tolazamide |
5 |
155.0 |
161.4 |
4.1 |
Dopamine |
13 |
162.8 |
164.6 |
1.1 |
Ascorbate |
3 |
162.8 |
168.6 |
3.6 |
EDTA |
640 |
162.8 |
170.0 |
4.4 |
Glutathione |
1 |
162.8 |
159.2 |
-2.2 |
Heparin |
1,000 |
162.8 |
161.8 |
-0.6 |
Ibuprofen |
40 |
159.8 |
154.2 |
-3.5 |
Salicylic acid |
50 |
162.8 |
161.0 |
-1.1 |
Tetracycline |
0.4 |
162.8 |
169.2 |
3.9 |
Tolbutamide |
100 |
159.8 |
156.8 |
-1.9 |
Urea |
500 |
162.8 |
175.8 |
8.0 |
Cholesterol |
500 |
157.7 |
169.0 |
7.2 |
TG |
3000 |
153.7 |
162.0 |
5.4 |
Glactose |
50 |
163.0 |
157.7 |
-3.3 |
Xylose |
10 |
163.0 |
163.7 |
0.4 |
Maltose |
300 |
163.0 |
155.3 |
-4.7 |
Alternative-Site Blood Glucose Measurement
Alternate site testing (AST) for glucose testing is an attractive, nearly painless alternative to the more painful fingertip site. The term alternate site testing (AST) means using parts of the body other than the finger tips to obtain blood for blood glucose testing. Blood glucose values from both sites are virtually equal at metabolic steady state. Unfortunately, due to rapid blood glucose changes, transient but clinically relevant differences between alternate site blood glucose and the fingertip blood glucose occur. During rapid blood glucose changes, the alternate site blood glucose lags behind the fingertip blood glucose by >30 min on average. As a result, the detection of hyperglycemia as well as hypoglycemia can be delayed.
Procedure:
To test the accuracy of the Infinity Automatic Coding Blood Glucose Monitoring System using AST, individuals participated in a study at three clinical sites. The participants were each provided with an Infinity Automatic Coding Blood Glucose Monitoring System labeled and packaged as it would be for the United States market in English. The testers were given sufficient time to read and understand instructions and the contents of the Infinity® system (on their own). Participants did not receive additional training, other instruction, assistance, or training material.
The individuals performed their own finger sticks and test themselves using Infinity® Automatic Coding Blood Glucose Monitoring System without supervision other than that necessary to insure that accurate results were properly recorded. The AST study participants were then asked to perform glucose tests on various test sites. First, participants measured the glucose using Infinity® following instruction for use with their finger’s capillary whole blood. Subsequently, the participants vigorously rubbed their arm (Upper arm or forearm) or Leg (calf or thigh) or palm (ventral palm or dorsal hand) as indicated on the data table, until they felt warming in the area for 5 to 10 seconds. The participants tested themselves using the Lancet device and procedures as indicated in the respective package inserts to collect the samples and to obtain the glucose levels using the Infinity® Automatic Coding Blood Glucose Monitoring System.The participants recorded their own glucose levels on a data sheet. Within five minutes of the participants collecting and testing their own sample, a healthcare professional collected capillary whole blood samples from participants’ finger-stick and a whole blood sample was collect in a capillary anticoagulant tube, centrifuged and then testing serum one time with Hitachi 747.
Conclusion:
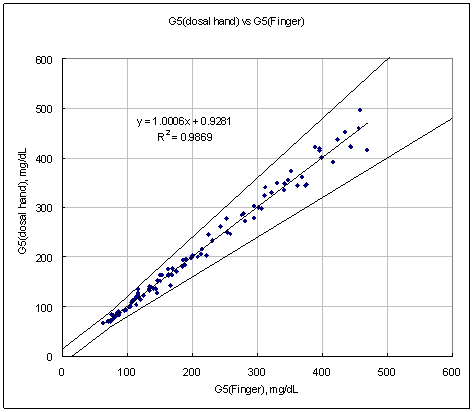
Results from all AST sites (dorsal hand, ventral palm, upper arm, forearm, calf, and thigh) are all in the clinically acceptable range compared to traditional finger-tip results.
DATA RESULTS
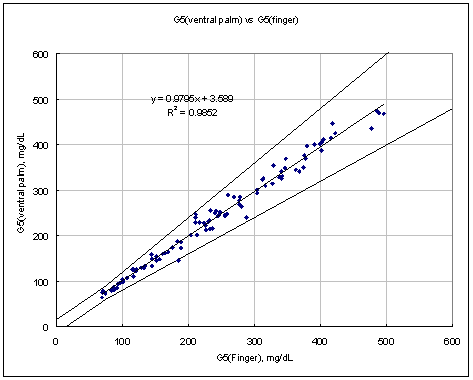
Figure 1. Linear regression with Palm results vs. Finger results.
Test Range 65 ~ 477 mg/dL
sample No = 100
data No = 100
Test Range 69 ~ 482 mg/dL
sample No = 102
data No = 102
Test Range 65 ~ 482 mg/dL
sample No = 202
data No = 202
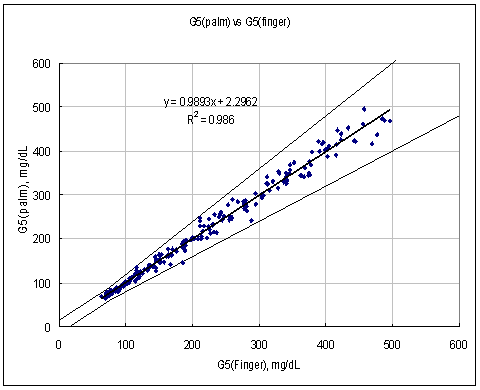
Figure 2. Linear regression with Arm results vs Finger results.
Test Range 64 ~ 480 mg/dL
sample No = 100
data No = 100
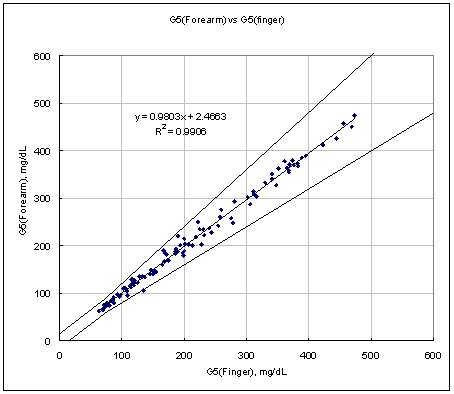
Test Range 65 ~ 471 mg/dL
sample No = 100
data No = 100
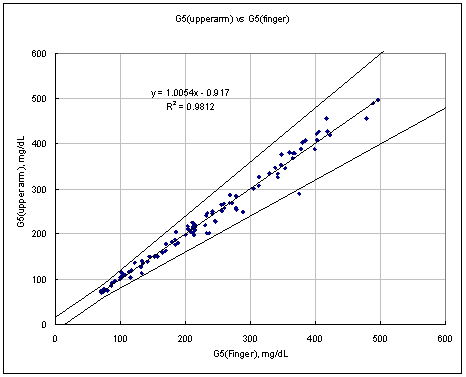
Test Range 64 ~ 480 mg/dL
sample No = 200
data No = 200
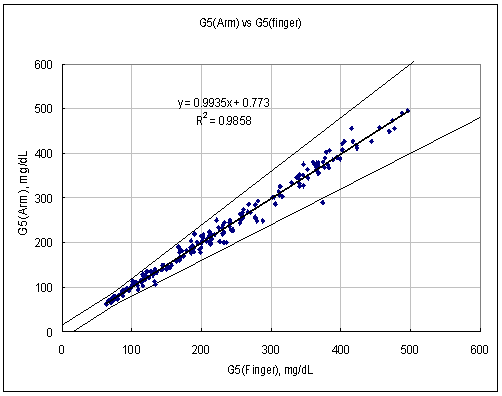
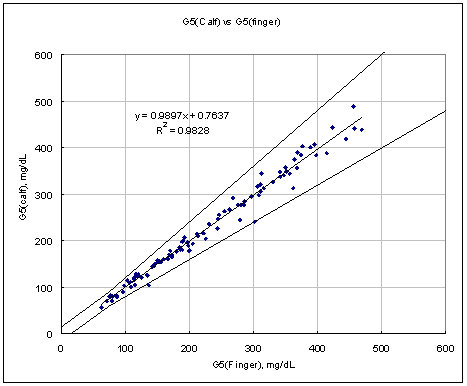
Figure 3. Linear regression with Leg results vs Finger results
Test Range 64 ~ 477 mg/dL
sample No = 100
data No = 100
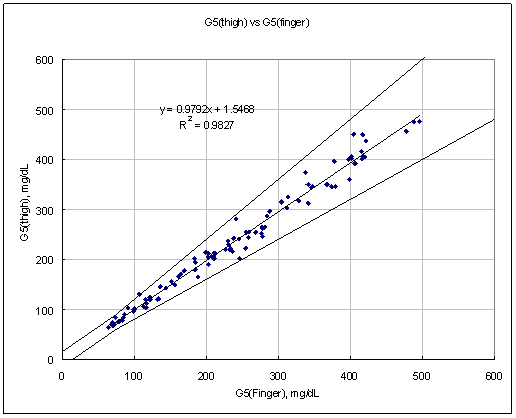
Test Range 65 ~ 471 mg/dL
sample No = 100
data No = 10
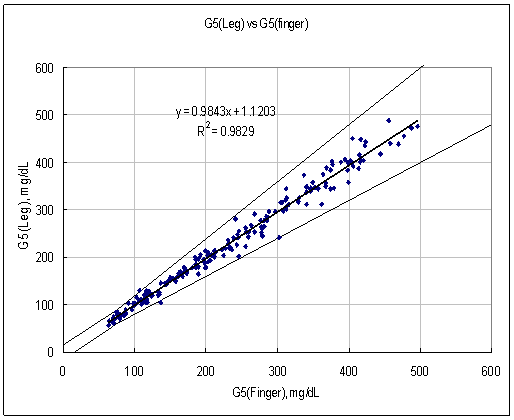
Test Range 64 ~ 477 mg/dL
sample No = 200
data No =200
ACCEPATANCE CRITERIA
The minimum acceptable accuracy for G5 INFINITY® results at finger vs. G5 INFINITY® results at AST site shall be as follows.
95% of the individual glucose results shall fall within ±15 mg/dL of the results of the manufacturer's measurement procedure at glucose concentration <75mg/dL and within 20% at glucose concentration (≥75mg/dL)
DATA ANALYSIS
Table 1. Data analysis with finger capillary blood and palm blood
G5 INFINITY®(DORSAL HAND) vs. G5 INFINITY®(FINGER) | |||||||||||
System accuracy results for glucose concentration <75 mg/dL (4.2 mmol/L) | |||||||||||
Within ± 5mg/dL |
Within ± 10 mg/dL |
Within ± 15mg/dL |
|||||||||
(within ± 0.28 mmol/L) |
(within ± 0.56 mmol/L) |
(within ± 0.83 mmol/L) |
|||||||||
5/5 (100 %) |
5/5(100 %) |
5/5(100%) |
|||||||||
System accuracy results for glucose concentration ≥75 mg/dL (4.2 mmol/L) | |||||||||||
Within ±5% |
Within ±10% |
Within ±15% |
Within ±20% |
||||||||
64/95(67%) |
90/95(95%) |
94/95(99%) |
95/95(100%) |
||||||||
G5 INFINITY®(VENTRAL PALM) vs. G5 INFINITY®(FINGER) | |||||||||||
System accuracy results for glucose concentration <75 mg/dL (4.2 mmol/L) | |||||||||||
Within ± 5mg/dL |
Within ± 10 mg/dL |
Within ± 15mg/dL |
|||||||||
(within ± 0.28 mmol/L) |
(within ± 0.56 mmol/L) |
(within ± 0.83 mmol/L) |
|||||||||
4/5 (80 %) |
5/5(100 %) |
5/5(100%) |
|||||||||
System accuracy results for glucose concentration ≥75 mg/dL (4.2 mmol/L) | |||||||||||
Within ±5% |
Within ±10% |
Within ±15% |
Within ±20% |
||||||||
65/97(67%) |
90/97(93%) |
94/97(97%) |
96/97(99%) |
||||||||
G5 INFINITY®(PALM) vs. G5 INFINITY®(FINGER) | |||||||||||
System accuracy results for glucose concentration <75 mg/dL (4.2 mmol/L) | |||||||||||
Within ± 5mg/dL |
Within ± 10 mg/dL |
Within ± 15mg/dL |
|||||||||
(within ± 0.28 mmol/L) |
(within ± 0.56 mmol/L) |
(within ± 0.83 mmol/L) |
|||||||||
9/10 (90 %) |
10/10(96 %) |
10/10(100%) |
|||||||||
System accuracy results for glucose concentration ≥75 mg/dL (4.2 mmol/L) | |||||||||||
Within ±5% |
Within ±10% |
Within ±15% |
Within ±20% |
||||||||
133/192(67%) |
186/192(94%) |
194/192(98%) |
197/192(99%) |
||||||||
Table 2. Data analysis with finger capillary blood and arm blood
G5 INFINITY®(FOREARM) vs. G5 INFINITY®(FINGER) | |||||||||||
System accuracy results for glucose concentration <75 mg/dL (4.2 mmol/L) | |||||||||||
Within ± 5mg/dL |
Within ± 10 mg/dL |
Within ± 15mg/dL |
|||||||||
(within ± 0.28 mmol/L) |
(within ± 0.56 mmol/L) |
(within ± 0.83 mmol/L) |
|||||||||
5/6 (83 %) |
6/6(100 %) |
6/6(100%) |
|||||||||
System accuracy results for glucose concentration ≥75 mg/dL (4.2 mmol/L) | |||||||||||
Within ±5% |
Within ±10% |
Within ±15% |
Within ±20% |
||||||||
62/94(66%) |
78/94(83%) |
92/94(98%) |
93/94(99%) |
||||||||
G5 INFINITY®(UPPERARM) vs. G5 INFINITY®(FINGER) | |||||||||||
System accuracy results for glucose concentration <75 mg/dL (4.2 mmol/L) | |||||||||||
Within ± 5mg/dL |
Within ± 10 mg/dL |
Within ± 15mg/dL |
|||||||||
(within ± 0.28 mmol/L) |
(within ± 0.56 mmol/L) |
(within ± 0.83 mmol/L) |
|||||||||
6/7 (86 %) |
7/7(100 %) |
7/7(100%) |
|||||||||
System accuracy results for glucose concentration ≥75 mg/dL (4.2 mmol/L) | |||||||||||
Within ±5% |
Within ±10% |
Within ±15% |
Within ±20% |
||||||||
66/93(71%) |
84/93(90%) |
92/93(99%) |
92/93(99%) |
||||||||
G5 INFINITY®(ARM) vs. G5 INFINITY®(FINGER) | |||||||||||
System accuracy results for glucose concentration <75 mg/dL (4.2 mmol/L) | |||||||||||
Within ± 5mg/dL |
Within ± 10 mg/dL |
Within ± 15mg/dL |
|||||||||
(within ± 0.28 mmol/L) |
(within ± 0.56 mmol/L) |
(within ± 0.83 mmol/L) |
|||||||||
11/13 (85 %) |
13/13(100 %) |
13/13(100%) |
|||||||||
System accuracy results for glucose concentration ≥75 mg/dL (4.2 mmol/L) | |||||||||||
Within ±5% |
Within ±10% |
Within ±15% |
Within ±20% |
||||||||
128/187(68%) |
162/187(87%) |
184/187(98%) |
185/187(99%) |
||||||||
Table 3. Data analysis with finger capillary blood and leg blood
G5 INFINITY®(CALF) vs. G5 INFINITY®(FINGER) | |||||||||||
System accuracy results for glucose concentration <75 mg/dL (4.2 mmol/L) | |||||||||||
Within ± 5mg/dL |
Within ± 10 mg/dL |
Within ± 15mg/dL |
|||||||||
(within ± 0.28 mmol/L) |
(within ± 0.56 mmol/L) |
(within ± 0.83 mmol/L) |
|||||||||
4/6 (67 %) |
6/6(100 %) |
6/6(100%) |
|||||||||
System accuracy results for glucose concentration ≥75 mg/dL (4.2 mmol/L) | |||||||||||
Within ±5% |
Within ±10% |
Within ±15% |
Within ±20% |
||||||||
59/94(63%) |
85/94(90%) |
92/94(98%) |
92/94(98%) |
||||||||
G5 INFINITY®(THIGH) vs. G5 INFINITY®(FINGER) | |||||||||||
System accuracy results for glucose concentration <75 mg/dL (4.2 mmol/L) | |||||||||||
Within ± 5mg/dL |
Within ± 10 mg/dL |
Within ± 15mg/dL |
|||||||||
(within ± 0.28 mmol/L) |
(within ± 0.56 mmol/L) |
(within ± 0.83 mmol/L) |
|||||||||
6/8 (75 %) |
8/8(100 %) |
8/8(100%) |
|||||||||
System accuracy results for glucose concentration ≥75 mg/dL (4.2 mmol/L) | |||||||||||
Within ±5% |
Within ±10% |
Within ±15% |
Within ±20% |
||||||||
57/92(62%) |
81/92(88%) |
89/92(97%) |
91/92(99%) |
||||||||
G5 INFINITY®( LEG) vs. G5 INFINITY®(FINGER) | |||||||||||
System accuracy results for glucose concentration <75 mg/dL (4.2 mmol/L) | |||||||||||
Within ± 5mg/dL |
Within ± 10 mg/dL |
Within ± 15mg/dL |
|||||||||
(within ± 0.28 mmol/L) |
(within ± 0.56 mmol/L) |
(within ± 0.83 mmol/L) |
|||||||||
10/14(71%) |
14/14(100 %) |
14/14(100 %) |
|||||||||
System accuracy results for glucose concentration ≥75 mg/dL (4.2 mmol/L) | |||||||||||
Within ±5% |
Within ±10% |
Within ±15% |
Within ±20% |
||||||||
116/186(62%) |
166/186(89%) |
181/186(97%) |
183/186(98%) |
||||||||

